Graphing Arctic Treelines
Alaska Pacific University | 2019 - 2024
Collaboration with Roman Dial & Sylvia Taylor
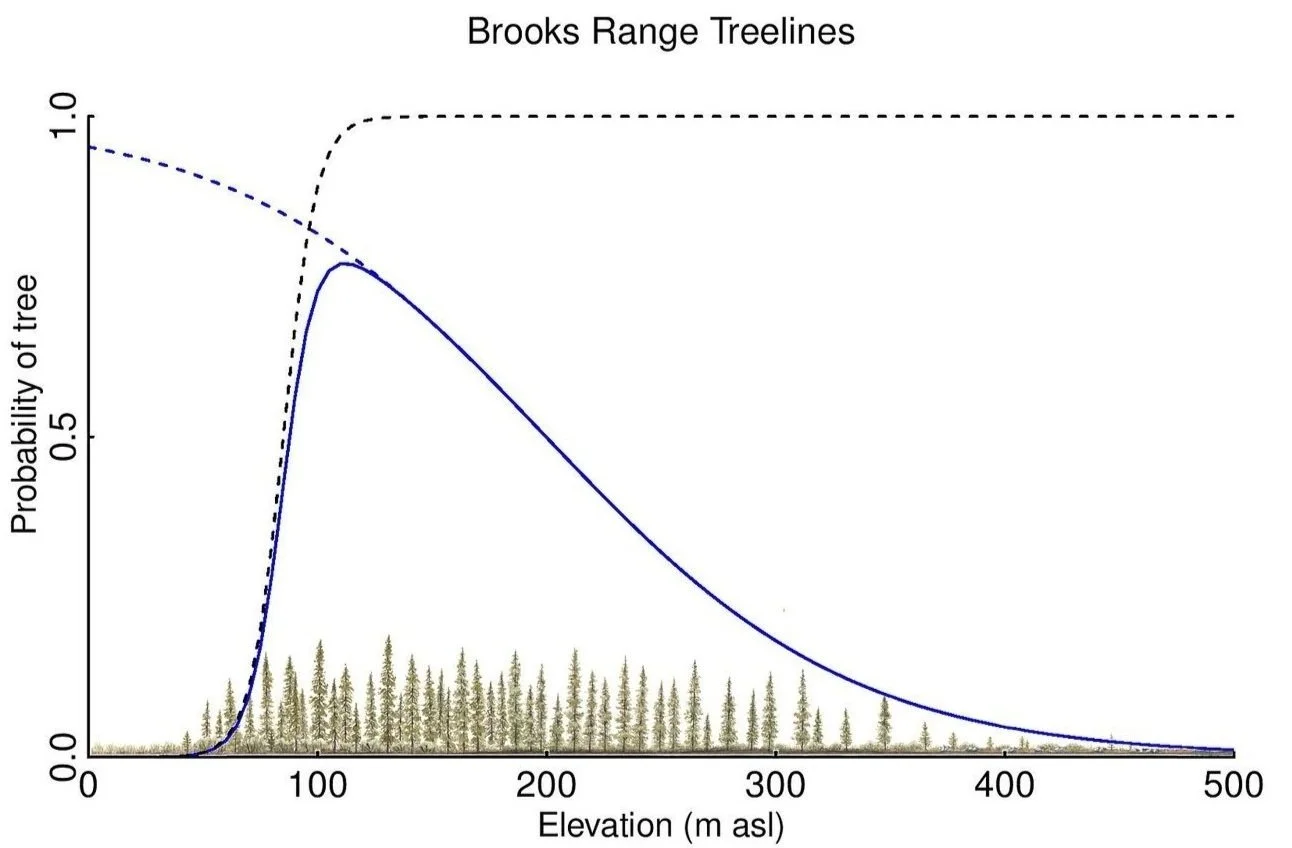
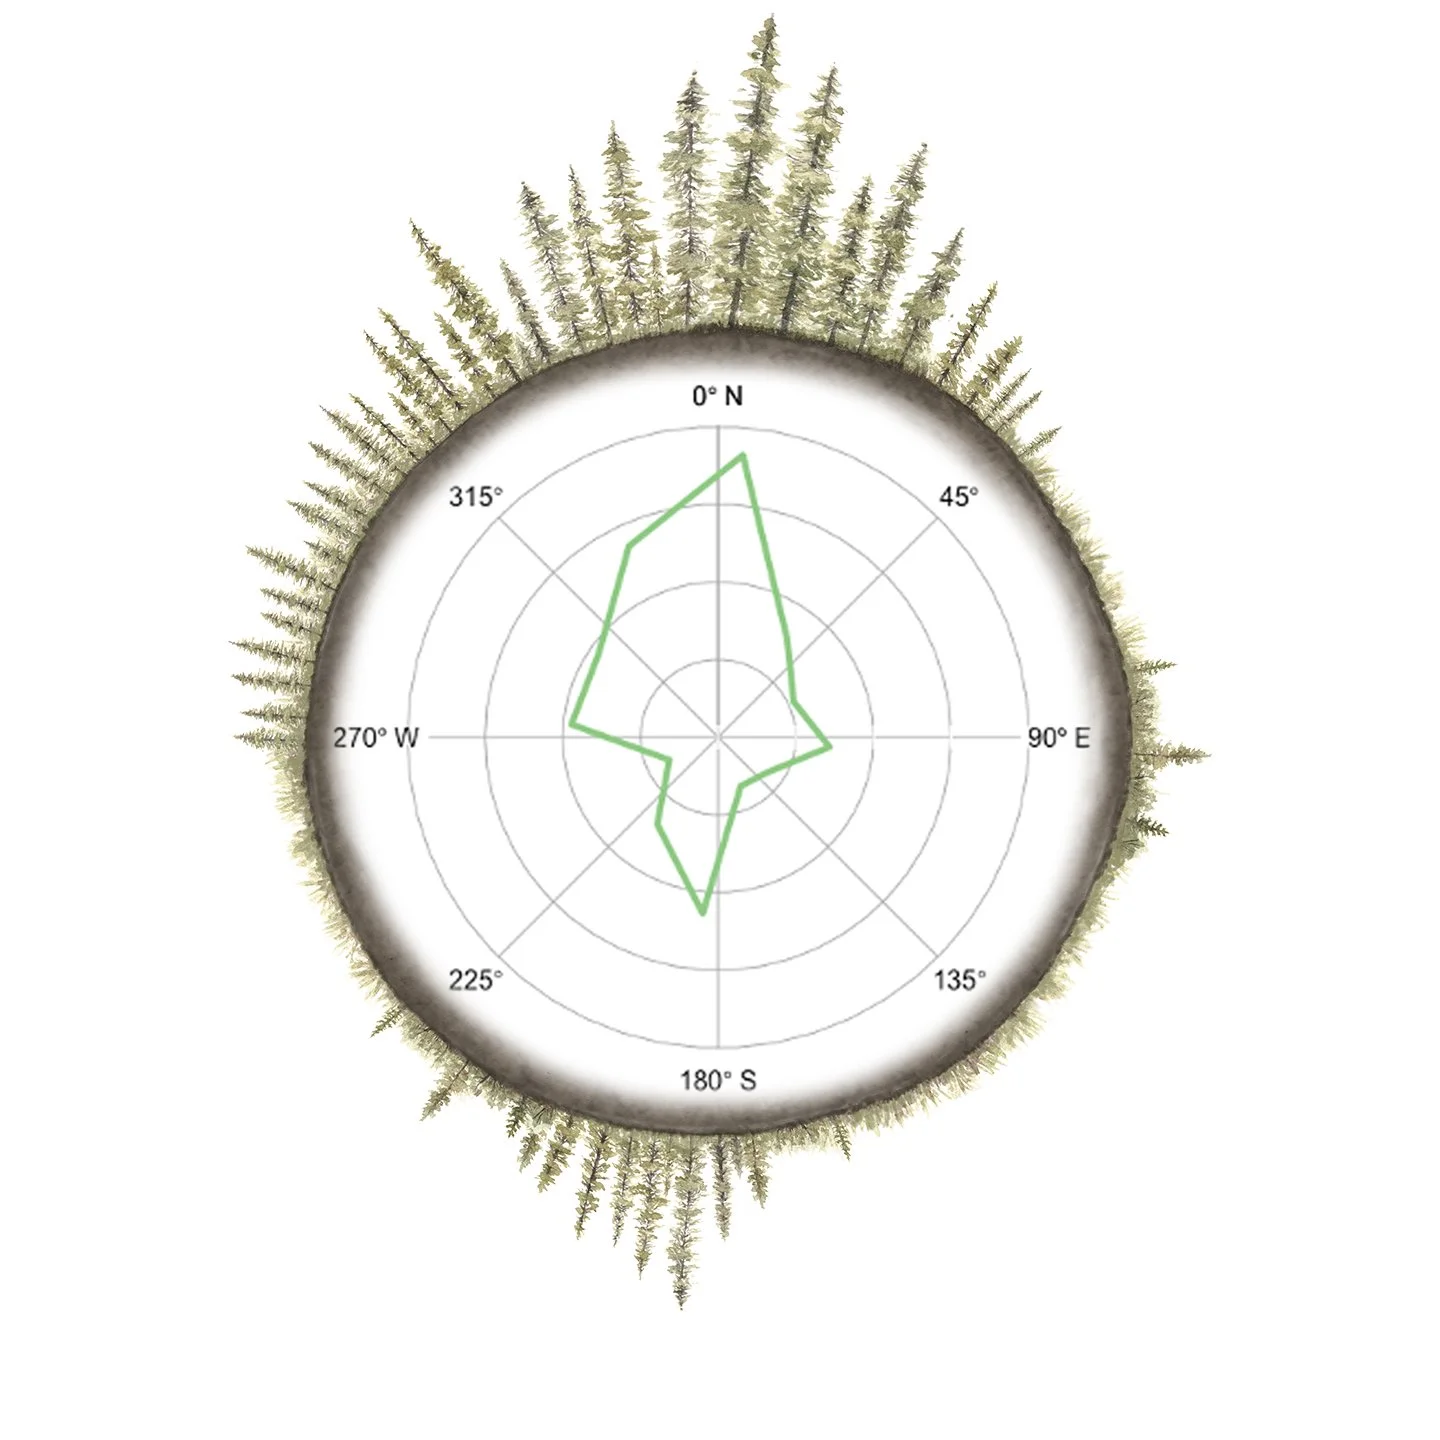
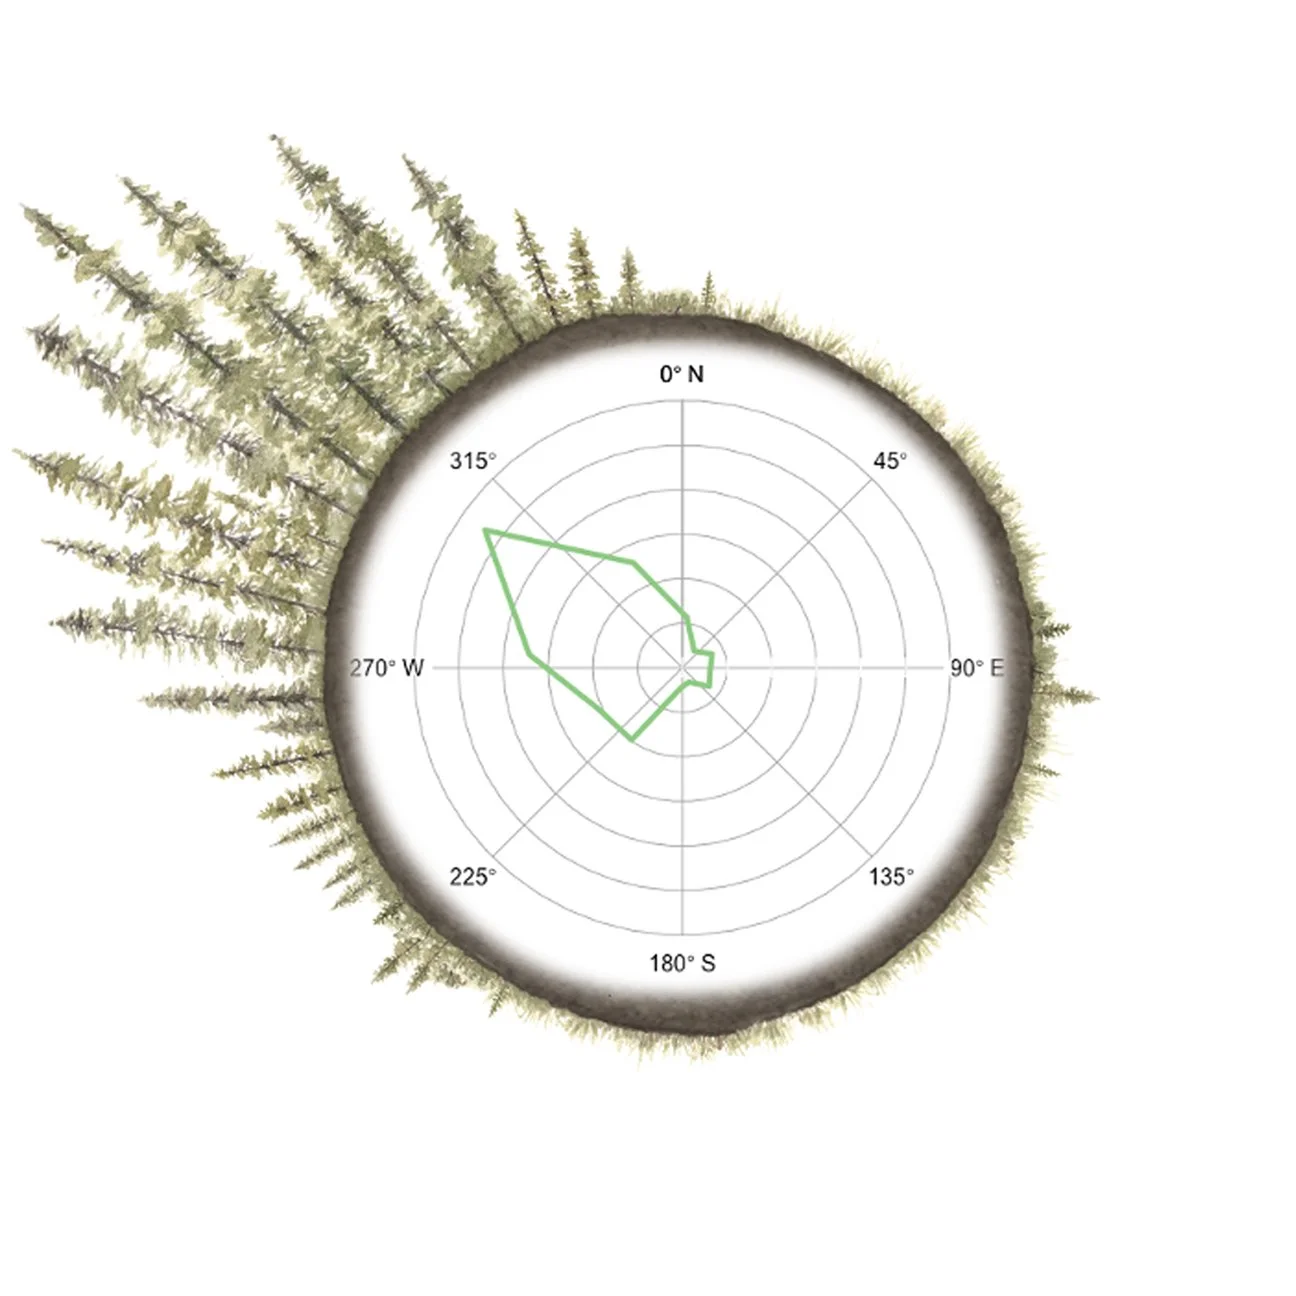
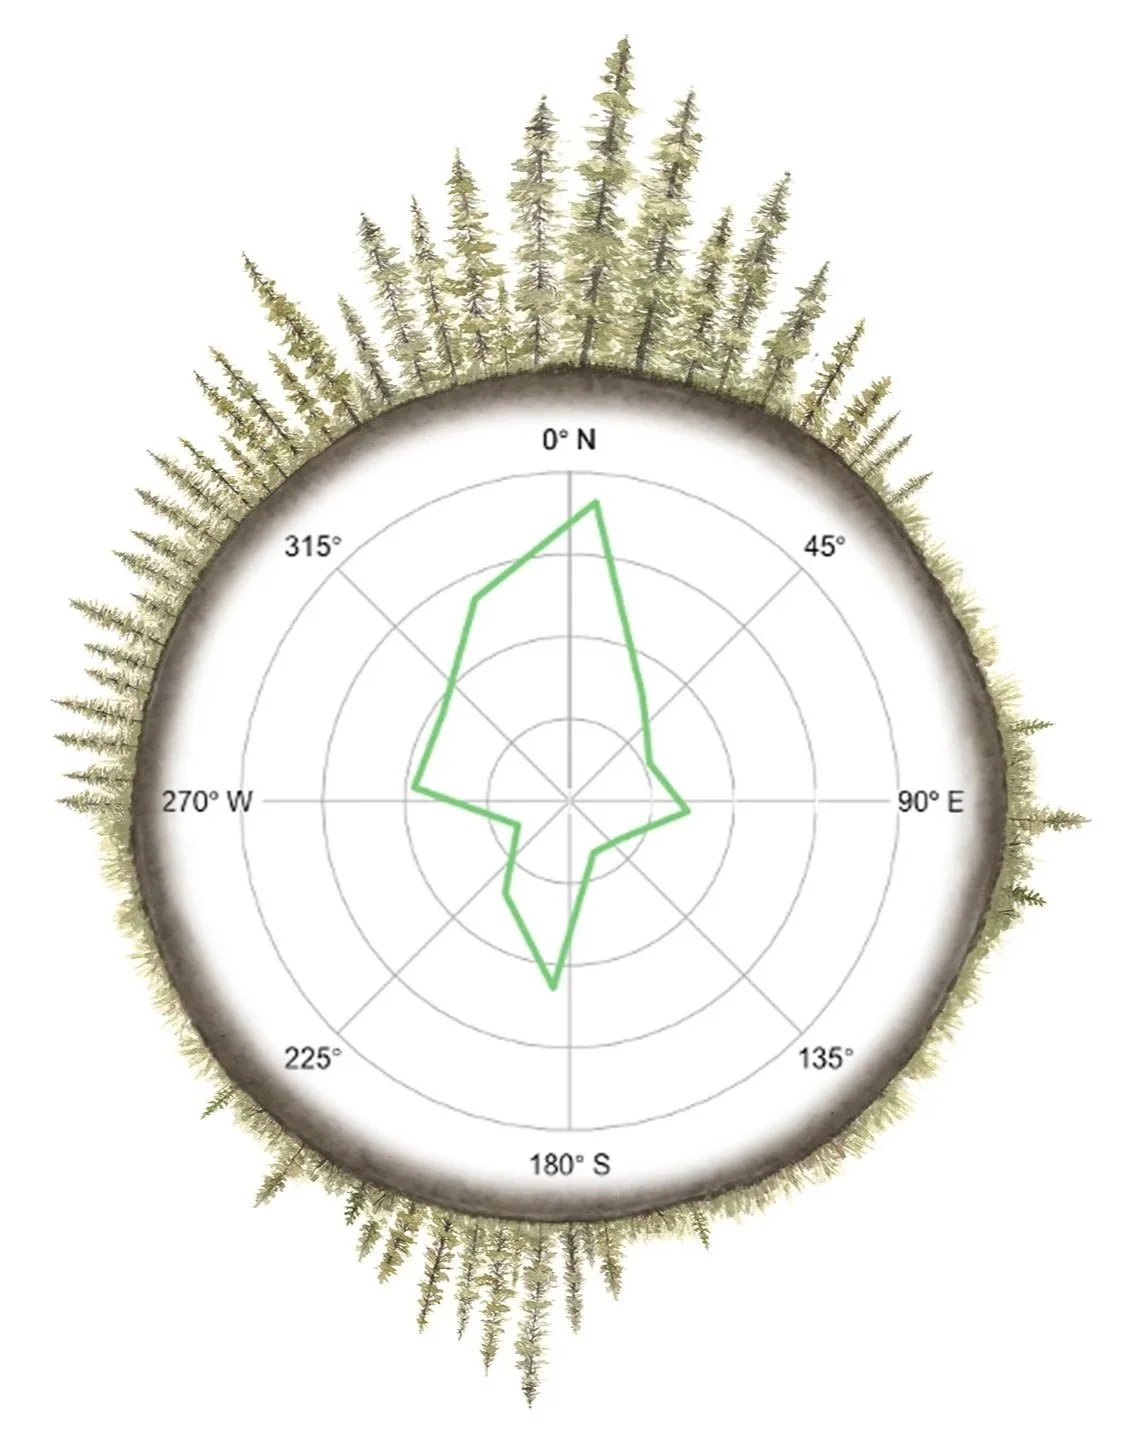
By combining illustration with traditional graphs, the goal of this project was to create engaging graphics that were easier and quicker to comprehend. Tall trees represent a higher likelihood of trees, but also emulate how treelines appear in the field, with tree height decreasing as you move away from a forest edge.
These graphs display tree probability as it relates to slope aspect (radial graphs) and elevation (xy plots).